Hallo liebe Community,
für ein Projekt brauchte ich eine einfache Möglichkeit, Liniendiagramme zu zeichnen.
Daher habe ich eine kleine Linechart Klasse geschrieben und möchte sie mit euch teilen.
Features:
 Größe (width/height) des Charts beliebig einstellbar (Berechnungen werden intern übernommen) Größe (width/height) des Charts beliebig einstellbar (Berechnungen werden intern übernommen)
Angezeigte Werte einstellbar (bei einem Wertebereich von z.B. 1 bis 1000 Werten, wäre es nicht Sinnvoll alle 1000 Werte am Rand des Charts anzuzeigen, sondern z.B. nur 10. 1, 100, 200, 300 ... 1000. Die Auflösung der Achse wird dabei nicht beeinflusst, lediglich die angezeigten Werte am Rand)
Automatisch Generierung der Legende
Layout und Farben einfach Konfigurierbar (siehe unten)
Konfigurationsmöglichkeiten
Show/Hide border
chart.showBorder = True/False
Show/Hide grid lines
chart.showXLines = True/False
chart.showYLines = True/False
Show/Hide labels
chart.showXLabel = True/False
chart.showYLabel = True/False
Maximum shown label values
chart.maxXLabelValues = 5
chart.maxYLabelValues = 5
Show/Hide X-Axis description (the id that has been given when X-Axis was created)
chart.showXAxisDesc = True/False
Show/Hide Y-Axis description (can be set via chart.SetYAxisDesc(desc:String)
chart.showYAxisDesc = True/False
Show/Hide chart name (the name that has been given when chart was created)
chart.showChartName = True/False
Show/Hide legend
chart.showLegend = True
Adjust the legend x and y values (default is top left corner of the chart)
chart.legendX = 20
chart.legendY = 20
Maximum decimal points of x label values
chart.xDecimalPoints = 2
Maximum decimal points of y label values
chart.yDecimalPoints = 2
Colors
Colors are given via red, green, blue values in a range between 0 to 255
chart.borderColor = [r, g, b]
chart.xLineColor = [r, g, b]
chart.yLineColor = [r, g, b]
chart.xLabelColor = [r, g, b]
chart.yLabelColor = [r, g, b]
chart.nameColor = [r, g, b]
chart.xAxisDescColor = [r, g, b]
chart.yAxisDescColor = [r, g, b]
Anwendungsbeispiel
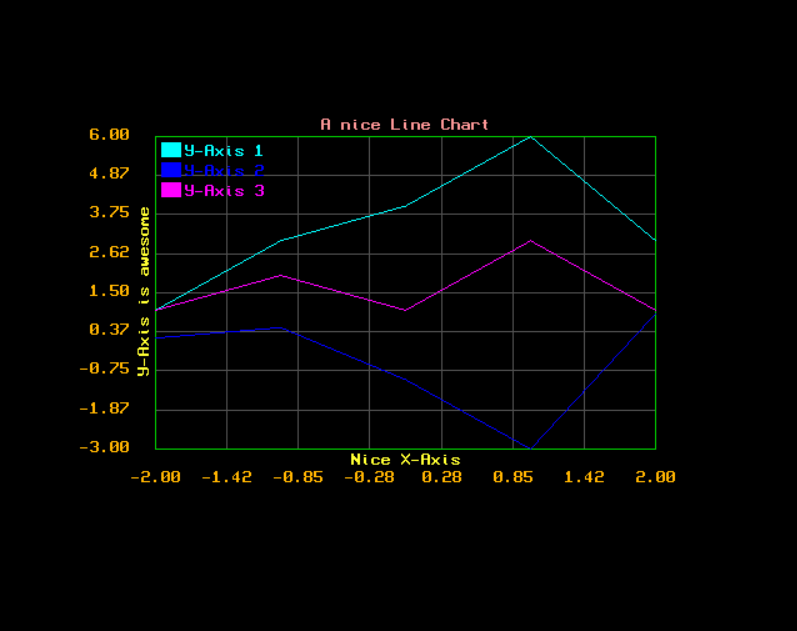
Das folgende Beispiel erzeugt den Chart aus dem obigen Screenshot
BlitzMax: [AUSKLAPPEN] [EINKLAPPEN]
Local chart:TLineChart = New TLineChart(200, 200, 400, 250, "A nice Line Chart")
chart.SetXaxis("Nice X-Axis", [-2.0, -1.0, 0.0, 1.0, 2.0])
chart.AddYAxis("Y-Axis 1", [1.0, 3.0, 4.0, 6.0, 3.0], [0, 255, 255])
chart.AddYAxis("Y-Axis 2", [0.2, 0.5, -1.0, -3.0, 0.9], [0, 0, 255])
chart.AddYAxis("Y-Axis 3", [1.0, 2.0, 1.0, 3.0, 1.0], [255, 0, 255])
chart.borderColor = [0, 200, 0]
chart.xLabelColor = [255, 180, 0]
chart.yLabelColor = [255, 180, 0]
chart.xLineColor = [80, 80, 80]
chart.yLineColor = [80, 80, 80]
chart.nameColor = [250, 150, 150]
chart.xAxisDescColor = [255, 255, 50]
chart.yAxisDescColor = [255, 255, 50]
chart.SetYAxisDesc("Y-Axis is awesome")
chart.maxXLabelValues = 8
chart.maxYLabelValues = 8
chart.xDecimalPoints = 2
chart.yDecimalPoints = 2
Graphics 1024, 600
While Not AppTerminate()
Cls
chart.Draw()
Flip
Wend
Klasse TLineChart
Den nachfolgenden Code einfach per copy&paste in eine eigene Datei kopieren und dann diese Datei via Include in das eigene Projekt einbinden.
BlitzMax: [AUSKLAPPEN] [EINKLAPPEN]
Type TLineChart
Private
Field _xAxis:TAxis
Field _yAxies:TList = New TList
Field _mostYElements:Int = 0
Field _biggestXValue:Float = 0
Field _lowestXValue:Float = 0
Field _biggestYValue:Float = 0
Field _lowestYValue:Float = 0
Field _xSpan:Float = 0
Field _ySpan:Float = 0
Field _xPos:Float
Field _yPos:Float
Field _width:Float
Field _height:Float
Field _name:String
Field _yAxisDesc:String = "Y-Axis"
Public
Field showXLines:Int = True
Field showYLines:Int = True
Field showBorder:Int = True
Field showXLabel:Int = True
Field showYLabel:Int = True
Field showXAxisDesc:Int = True
Field showYAxisDesc:Int = True
Field showChartName:Int = True
Field showLegend:Int = True
Field maxXLabelValues:Int = 5
Field maxYLabelValues:Int = 5
Field legendX:Float
Field legendY:Float
Field xDecimalPoints:Int = 2
Field yDecimalPoints:Int = 2
Field nameColor:Int[] = [255, 255, 255]
Field borderColor:Int[] = [255, 255, 255]
Field xLineColor:Int[] = [255, 255, 255]
Field yLineColor:Int[] = [255, 255, 255]
Field xLabelColor:Int[] = [255, 255, 255]
Field yLabelColor:Int[] = [255, 255, 255]
Field xAxisDescColor:Int[] = [255, 255, 255]
Field yAxisDescColor:Int[] = [255, 255, 255]
Public
Method New(xPos:Float, yPos:Float, width:Float, height:Float, name:String = "Line Chart")
Self._xPos = xPos
Self._yPos = yPos
Self._width = width
Self._height = height
Self._name = name
Self.legendX = _xPos + 5
Self.legendY = _yPos + 5
End Method
Method Clear()
_yAxies.Clear()
TAxis._ids.Clear()
End Method
Method SetPosition(x:Float, y:Float)
Self._xPos = x
Self._yPos = y
End Method
Method SetSize(width:Float, height:Float)
Self._width = width
Self._height = height
End Method
Method SetXaxis(id:String, values:Float[])
Clear()
_xAxis = New TAxis(id, values)
_xSpan = _xAxis.values.length
_lowestXValue = _xAxis.values[0]
_biggestXValue = _xAxis.values[_xAxis.values.length-1]
End Method
Method SetYAxisDesc(str:String)
_yAxisDesc = str
End Method
Method AddYAxis(id:String, values:Float[], color:Int[]=Null)
For Local val:Float = EachIn values
If val > _biggestYValue _biggestYValue = val
If val < _lowestYValue _lowestYValue = val
Next
If values.length > _mostYElements _mostYElements = values.length
_yAxies.AddLast(New TAxis(id:String, values, color))
_ySpan = _biggestYValue - _lowestYValue
End Method
Method Draw()
If _xAxis = Null RuntimeError("TLineChart: xAxis not set")
If _yAxies.IsEmpty() RuntimeError("TLineChart: no yAxis set")
If _xAxis.values.length < _mostYElements RuntimeError("TLineChart.Draw(): x-axis values count should be greater or equal to the greatest y-axis values count. Otherwise chart is going to exceed the chart boundaries.")
Local stepX:Float = _width / (_xSpan-1)
Local stepY:Float = _height / _ySpan
If showXLines drawXGridLines()
If showYLines drawYGridLines()
If showXLabel drawXLabel()
If showYLabel drawYLabel()
If showBorder drawBorder()
If showChartName drawChartName()
If showXAxisDesc drawXAxisDesc()
If showYAxisDesc drawYAxisDesc()
If showLegend drawLegend()
Local originX:Float = _xPos
Local originY:Float = _yPos + _height - stepY*Abs(_lowestYValue)
Local dx:Int = 0
Local lastX:Float = originX
Local lastY:Float = originY
Local x:Float
Local y:Float
For Local i:Int = 0 To _xAxis.values.length-1
For Local yAxis:TAxis = EachIn _yAxies
SetColor(yAxis.color[0], yAxis.color[1], yAxis.color[2])
For Local yVal:Float = EachIn yAxis.values
x = originX+stepX*dx
y = originY-stepY*yVal
If Not dx = 0 DrawLine(x, y, lastX, lastY)
dx :+ 1
lastX = x
lastY = y
Next
dx = 0
lastX = originX
lastY = originY
Next
Next
SetColor(255, 255, 255)
End Method
Private
Method drawChartName()
SetColor(nameColor[0], nameColor[1], nameColor[2])
Local x:Float = _xPos + _width/2 - TextWidth(_name)/2
Local y:Float = _yPos - TextHeight(_name)
DrawText(_name, x, y)
SetColor(255, 255, 255)
End Method
Method drawLegend()
Local yOffset:Float = TextHeight("some text")/2+8
Local i:Int = 0
Local x:Float = 0
Local y:Float = 0
For Local yAxis:TAxis = EachIn _yAxies
SetColor(yAxis.color[0], yAxis.color[1], yAxis.color[2])
DrawRect(legendX, legendY+yOffset*i, TextHeight(yAxis.id), TextHeight(yAxis.id)/2+4)
x = legendX + (TextHeight(yAxis.id)+2)
y = legendY + yOffset*i
DrawText(yAxis.id, x, y)
i :+ 1
Next
End Method
Method drawXAxisDesc()
SetColor(xAxisDescColor[0], xAxisDescColor[1], xAxisDescColor[2])
Local x:Float = _xPos + _width/2 - TextWidth(_xAxis.id)/2
Local y:Float = _yPos + _height + 2
DrawText(_xAxis.id, x, y)
SetColor(255, 255, 255)
End Method
Method drawYAxisDesc()
SetColor(yAxisDescColor[0], yAxisDescColor[1], yAxisDescColor[2])
Local x:Float = _xPos - TextHeight(_yAxisDesc)
Local y:Float = _yPos + _height/2 + TextWidth(_yAxisDesc)/2
SetRotation(-90)
DrawText(_yAxisDesc, x, y)
SetRotation(0)
SetColor(255, 255, 255)
End Method
Method drawBorder()
SetColor(borderColor[0], borderColor[1], borderColor[2])
DrawLine(_xPos, _yPos, _xPos+_width, _yPos)
DrawLine(_xPos, _yPos, _xPos, _yPos+_height)
DrawLine(_xPos+_width, _yPos, _xPos+_width, _yPos+_height)
DrawLine(_xPos, _yPos+_height, _xPos+_width, _yPos+_height)
SetColor(255, 255, 255)
End Method
Method drawXGridLines()
SetColor(xLineColor[0], xLineColor[1], xLineColor[2])
Local stepX:Float = _width / (maxXLabelValues -1)
For Local xl:Int = 1 To maxXLabelValues -2
DrawLine(_xPos+stepX*xl, _yPos, _xPos+stepX*xl, _yPos+_height)
Next
SetColor(255, 255, 255)
End Method
Method drawYGridLines()
SetColor(yLineColor[0], yLineColor[1], yLineColor[2])
Local stepY:Float = _height / maxYLabelValues
For Local yl:Int = 1 To maxYLabelValues -1
DrawLine(_xPos, _yPos+stepY*yl, _xPos+_width, _yPos+stepY*yl)
Next
SetColor(255, 255, 255)
End Method
Method drawXLabel()
SetColor(xLabelColor[0], xLabelColor[1], xLabelColor[2])
Local dist:Float = _biggestXValue - _lowestXValue
Local steps:Int = maxXLabelValues -1
Local partialDist:Float = dist / steps
Local stepX:Float = _width / steps
For Local i:Int = 0 To steps
Local value:String = floatToString(xDecimalPoints, _lowestXValue + partialDist*i)
DrawText(value, (_xPos+stepX*i)-TextWidth(value)/2, _yPos+_height+TextHeight(value))
Next
SetColor(255, 255, 255)
End Method
Method drawYLabel()
SetColor(yLabelColor[0], yLabelColor[1], yLabelColor[2])
Local dist:Float = _biggestYValue - _lowestYValue
Local steps:Int = maxYLabelValues
Local partialDist:Float = dist / steps
Local stepY:Float = _height / steps
For Local i:Int = 0 To steps
Local value:String = floatToString(yDecimalPoints, _lowestYValue + partialDist*i)
DrawText(value, _xPos-TextWidth(value)-TextHeight(_yAxisDesc)-5, (_yPos+_height-stepY*i)-TextHeight(value)/2)
Next
SetColor(255, 255, 255)
End Method
Method floatToString:String(decimalPlaces:Int, val:Float)
If decimalPlaces < 0 RuntimeError("TLineChart.floatToString: decimalPlaces must be greater or equal to 0")
If decimalPlaces = 0 Return String(Int(val))
Local strVal:String = String(val)
Local pointPos:Int = Instr(strVal, ".")
Local valBeforePoint:String = Left(strVal, pointPos-1)
Local valAfterPoint:String = Mid(strVal, pointPos+1)
Local trimmed:String = Left(valAfterPoint, decimalPlaces)
Return valBeforePoint + "." + trimmed
End Method
End Type
Type TAxis
Private
Global _ids:TList = New TList
Public
Field values:Float[]
Field id:String
Field color:Int[] = [255, 255, 255]
Public
Method New(id:String, values:Float[], color:Int[]=Null)
If Not isUniqueID(id) RuntimeError("TAxis: duplicate id: '" + id + "'")
Self.id = id
Self.values = values
If color <> Null
If color.length > 3 RuntimeError("TAxis.color: color must be of type r g b")
For Local i:Int = 0 To color.length-1
If i < 0 Or i > 255 RuntimeError("TAxis.color: color value must be between 0 and 255")
Next
Self.color = color
EndIf
_ids.AddLast(id)
End Method
Private
Method isUniqueID:Int(id:String)
For Local i:String = EachIn _ids
If i = id Return False
Next
Return True
End Method
End Type
|